This post examines corporation creation in the City of Utica. We looked at the numbers of corporations created in the City between the years of 1982 and 2016. Below is a visualization of that data.
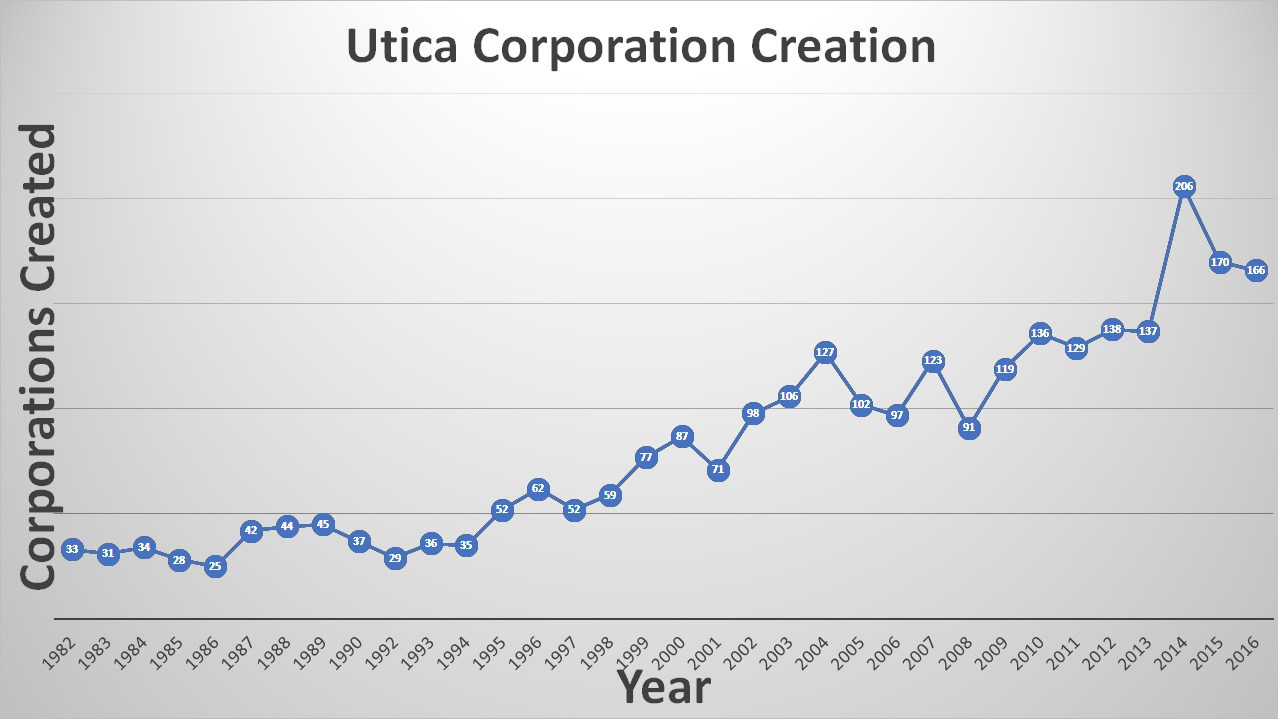
There are a number of things that can be learned from this data. First, since around 1994 Utica has seen a relatively steady growth in the number of corporations created overall. The years between 1982 and 1994 saw a very stagnate number of corporation creation. During that 12 year span corporation creation hovered between a low of 25 and high of 45. However, since ’94 the overall numbers of corporation creation has grown greatly.
Second, what is very interesting is that during the Great Recession corporation creation actually increased in the City of Utica. Between the years of 2008 and 2010 corporation creation actually increased from 91 to a then all time high of 136.
Finally, it is important to note that the City is currently experiencing the highest number of corporation creation. Over the last few years, 2014-2016, corporation creation has reached its highest levels within in the City. 2014 alone saw the highest number in creation at 206. While 2015 and 2016 saw lower numbers, 170 and 166 respectively, these numbers are still all time highs for the City.
Below is a table of all the information:
| Utica Corporation Creation | |
| Year | Corporations Created |
| 1982 | 33 |
| 1983 | 31 |
| 1984 | 34 |
| 1985 | 28 |
| 1986 | 25 |
| 1987 | 42 |
| 1988 | 44 |
| 1989 | 45 |
| 1990 | 37 |
| 1992 | 29 |
| 1993 | 36 |
| 1994 | 35 |
| 1995 | 52 |
| 1996 | 62 |
| 1997 | 52 |
| 1998 | 59 |
| 1999 | 77 |
| 2000 | 87 |
| 2001 | 71 |
| 2002 | 98 |
| 2003 | 106 |
| 2004 | 127 |
| 2005 | 102 |
| 2006 | 97 |
| 2007 | 123 |
| 2008 | 91 |
| 2009 | 119 |
| 2010 | 136 |
| 2011 | 129 |
| 2012 | 138 |
| 2013 | 137 |
| 2014 | 206 |
| 2015 | 170 |
| 2016 | 166 |
| Information Gathered from OpenDataNY.com | |
