This is a first in a series of posts about the economy in the Mohawk Valley.
One indicator of an economy is corporation creation. That is, the number of corporations created in a given location. For this post we looked at the numbers of corporations formed in Oneida County from the years of 1978 to 2016. Below is a visualization of the number of corporations created between those years.
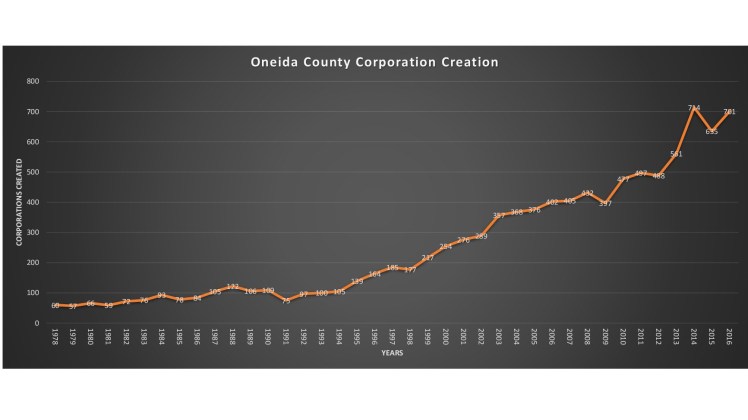
This graph shows a number of things. First, the number of corporations being created continues to rise since 1977. Out of the 38 years only 8 saw a decrease in corporation creation from the previous year. Also, there were no two straight years of creation reduction. The largest gain was from 2013 to 2014 when corporation creation jumped from 561 to the current all time high of 714.
Second, you can see the county’s longest growth streak so far was between the years of 1998 and 2009. The sharp decline in 2009 can reasonably be attributed to the Great Recession. What is interesting however, is that the number of corporations created in 2010 shot up to what was then an all time high at 477.
Finally, while the longest continuous growth streak was from 1998 to 2009, the last few years have shown the greatest amount of growth in corporation creation. The largest gains so far for the county were in the years of 2014 (714), 2015 (635), and 2016 (701).
Below is a table of all the data.
| Oneida County Corporation Creation | |
| Year | Corporations Created |
| 2016 | 701 |
| 2015 | 635 |
| 2014 | 714 |
| 2013 | 561 |
| 2012 | 488 |
| 2011 | 497 |
| 2010 | 477 |
| 2009 | 397 |
| 2008 | 432 |
| 2007 | 405 |
| 2006 | 402 |
| 2005 | 376 |
| 2004 | 368 |
| 2003 | 357 |
| 2002 | 289 |
| 2001 | 276 |
| 2000 | 254 |
| 1999 | 217 |
| 1998 | 177 |
| 1997 | 185 |
| 1996 | 164 |
| 1995 | 139 |
| 1994 | 105 |
| 1993 | 100 |
| 1992 | 97 |
| 1991 | 75 |
| 1990 | 109 |
| 1989 | 106 |
| 1988 | 122 |
| 1987 | 105 |
| 1986 | 84 |
| 1985 | 78 |
| 1984 | 93 |
| 1983 | 76 |
| 1982 | 72 |
| 1981 | 59 |
| 1980 | 66 |
| 1979 | 57 |
| 1978 | 60 |
