A continuation on a series of Corporation Creation in the Mohawk Valley. This post examines the number of corporations created in Herkimer County between the years of 1983 and 2016. Below is a visualization of this information.
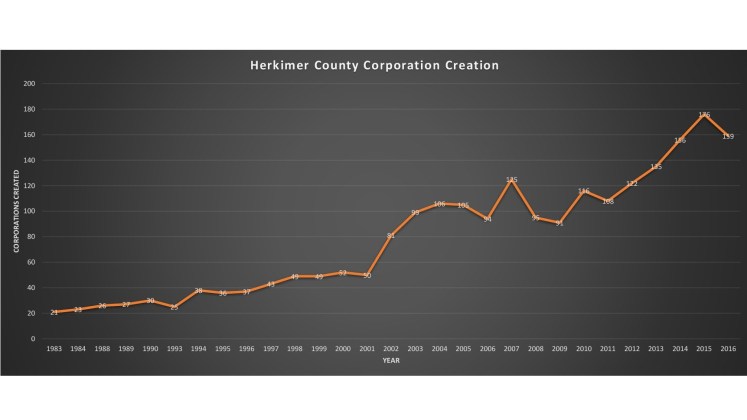
There are a number of things that can be learned from this information. First, just as with Oneida County, Herkimer County has generally had a long increase in corporation creation since 1983. What is interesting to note is that Herkimer County did not fall in corporation creation as bad as Oneida County during the Great Recession. Out of the 28 years accounted for, only 7 of these had a reduction in creation from the previous year.
Second, unlike Oneida County, Herkimer County has experienced a period of decreased creation that lasted more than one year. There are 3 straight years of decreased creation between the years of 2004 and 2006. However, the following year of 2007 saw corporation creation jump up to a then all time high of 125.
Finally, just as with Oneida County, Herkimer County has experienced all time highs in corporation creation over the last few years. Between 2011 and 2015 corporation creation has had its sharpest incline from 108 to 176, the current all time high. This growth only tapered off a bit in 2016 at 159.
Below is a table of all the information:
| Herkimer County Corporation Creation | |
| Year | Corporations Created |
| 2016 | 159 |
| 2015 | 176 |
| 2014 | 156 |
| 2013 | 135 |
| 2012 | 122 |
| 2011 | 108 |
| 2010 | 116 |
| 2009 | 91 |
| 2008 | 95 |
| 2007 | 125 |
| 2006 | 94 |
| 2005 | 105 |
| 2004 | 106 |
| 2003 | 99 |
| 2002 | 81 |
| 2001 | 50 |
| 2000 | 52 |
| 1999 | 49 |
| 1998 | 49 |
| 1997 | 43 |
| 1996 | 37 |
| 1995 | 36 |
| 1994 | 38 |
| 1993 | 25 |
| 1990 | 30 |
| 1989 | 27 |
| 1988 | 26 |
| 1984 | 23 |
| 1983 | 21 |
| Information Gathered from OpenDataNY.com | |
